
Our Services Coverage.
These online Sustainable Business Services and the Certo Program are currently available in the English speaking countries shown below. Select your country and learn about how countries compare with respective environmental efforts and which issues are affecting sustainability for businesses in your country (France has been added for comparison purposes). The countries are ordered from best to worst performers by comparison.
Overview summary of sustainability efforts in Canada
Overview of SDG Achievements
The UN ranks all member countries by their overall score on the SDG Performance Website. The overall score measures a country's total progress towards achieving all 17 SDGs. The score can be interpreted as a percentage of SDG achievement. Canada is ranked 21 out of the 173 UN Member States, so many Canada businesses are already making good progress in achieving the goals.
Overview of Environmental Performance
Yale University recently ranked 180 largest countries by their overall score on the Environmental Performance Website. The overall score measures a country's performance across 32 different indicators, and these ranged from climate change mitigation to air quality. Canada is ranked 20 out of the 180 countries assessed, so Canada is already making good inroads into achieving high environmental performance standards.
Overview of Emission Comparisons
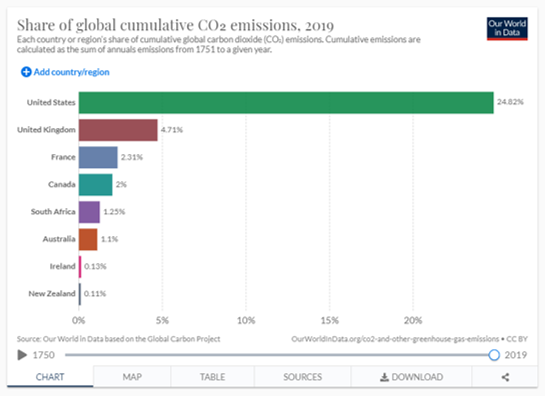
The Our World in Data website provides fee information on emissions per country. The following charts have been sourced from this website and contributions are credited to Hannah Ritchie and Max Roser (2020) "COâ‚‚ and Greenhouse Gas Emissions". Published online at OurWorldInData.org. Retrieved from: 'https://ourworldindata.org/co2-and-other-greenhouse-gas-emissions' [Online Resource]
Canada represents 2% of global COâ‚‚ emissions:
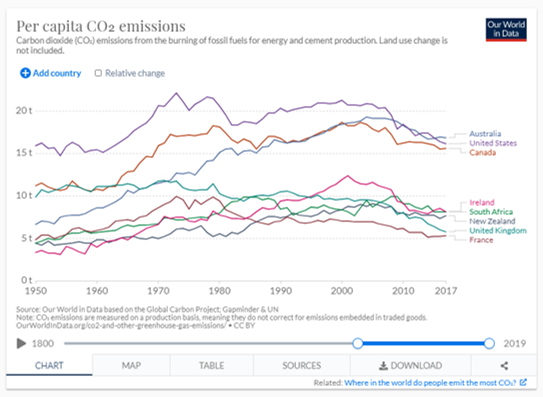
Average annual COâ‚‚ emissions in Canada equates to 15.4 tons per capita:
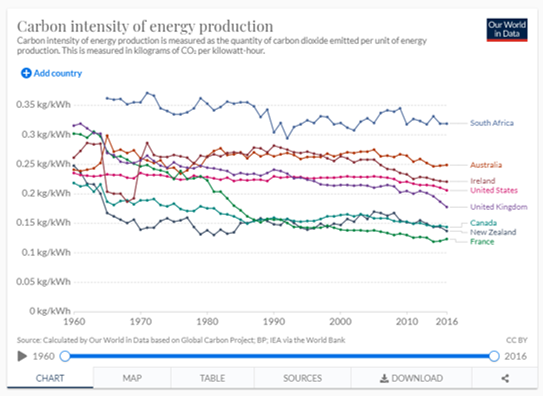
On average, Canada emits 0.14kg of COâ‚‚ to generate 1kWh of electricity:
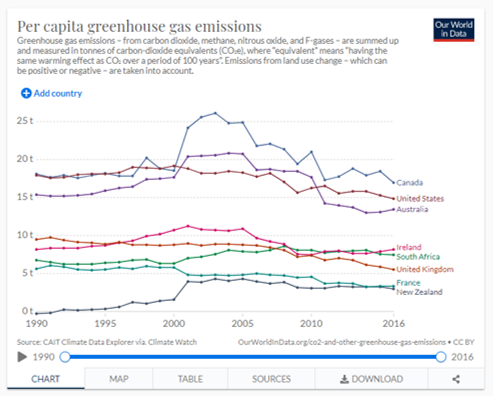
Average GHG emissions equivalent for 100 years in Canada equates to 16.93 tons per capita (the highest in these comparisons):
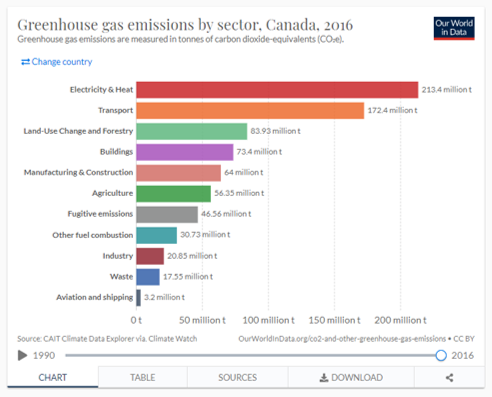
Canada emits most of its GHGs to generate electricity, to produce heat and for transportation:
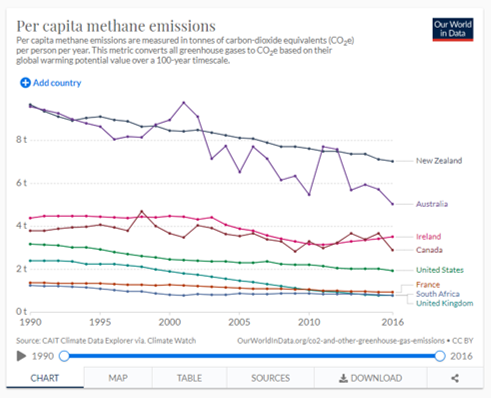
Average annual Methane emissions (COâ‚‚ equivalent) in Canada equates to 2.9 tons per capita:
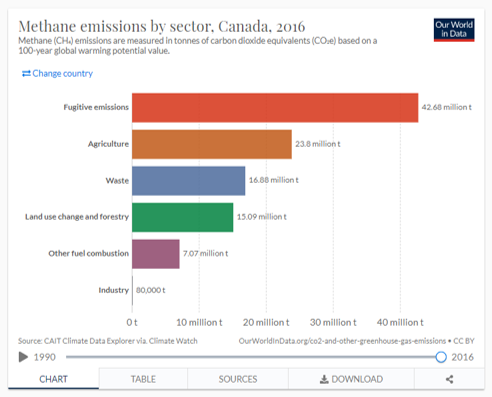
Canada emits most of its Methane through fugitive emissions (accidental emissions of vapors or gases from pressurized apparatus, either due to faulty equipment, leakage or other unforeseen mishaps, and through evaporation - such sources as storage tanks or wastewater treatment facilities):
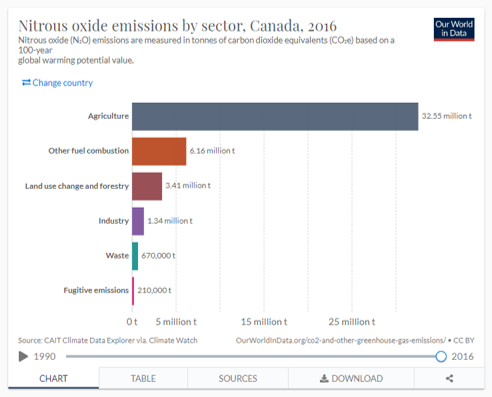
Average annual Nitrous Oxide emissions (COâ‚‚ equivalent) in Canada equates to 1.22 tons per capita:
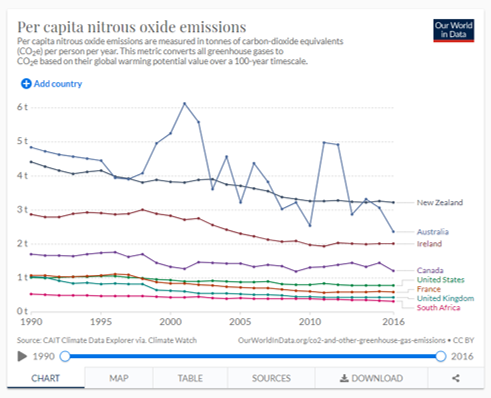
Canada emits most of its Nitrous Oxide in the agriculture sector:
Additional Information
 | Canada's Voluntary SDG National Review 2018 (8.58mb) |
Frequently Asked Questions
- What is Canada's support for the UN goals?Canada is committed to implementing the 2030 Agenda and its Sustainable Development Goals at home and abroad. As Prime Minister Justin Trudeau said in his address to the UN in September 2017, “the SDGs are as meaningful in Canada as they are everywhere else in the world.†View the information here: https://sustainabledevelopment.un.org/memberstates/canada
- What is the GRI reporting tool?GRI stands for Global Reporting Initiative, this is an independent international organization that has pioneered sustainability reporting since 1997. GRI helps businesses and governments worldwide understand and communicate their impact on critical sustainability issues such as climate change, human rights, governance and social well-being. This enables real action to create social, environmental and economic benefits for everyone. The GRI Sustainability Reporting Standards fall under Universal, Economic, Environmental and Social topics, they are developed with true multi-stakeholder contributions and rooted in the public interest. Find out more here.
- What is Social Responsibility ISO 26000?ISO 26000:2010 provides guidance rather than requirements, so it cannot be certified to unlike some other well-known ISO standards. Instead, it helps clarify what social responsibility is, helps businesses and organizations translate principles into effective actions and shares best practices relating to social responsibility, globally. It is aimed at all types of organizations regardless of their activity, size or location.
The standard was launched in 2010 following five years of negotiations between many different stakeholders across the world. Representatives from government, NGOs, industry, consumer groups and labour organizations around the world were involved in its development, which means it represents an international consensus. - What are the UN Sustainable Development Goals?Created by the UN, the Sustainable Development Goals are the blueprint to achieve a better and more sustainable future for all. The 17 Goals address the global challenges we face, including those related to poverty, inequality, climate, environmental degradation, prosperity, and peace and justice. The 17 Goals interconnect and in order to leave no one behind, it is important that businesses acknowledge and achieve pertinent and relevant Goals and targets by 2030. Find out more here.
- What is the Certo Online Sustainable Program?Our main service is the Certo Online Program, this is designed to take businesses along a sustainable pathway so they can best manage changes within their business. Once registered, a unique Certo reference number is supplied for each business and these are used for confidential reporting purposes. Your business is supplied with a work program (guides and templates) and is responsible for competing all information (guided by us). An initial online presentation and training session is completed, with follow up sessions if needed. Our online Tracker form is completed at the start of the program, then again after 3 months (to achieve Starter progress – the minimum status expected to be achieved) and again after 9 months (to achieve Operating status).
Every year the form must be completed in order to record progress made by companies. Energy, water and waste is recorded along with benchmarking data: business type, floor area, employee numbers. This allows companies to be compared, using their sustainability profile with the profiles of like businesses (confidential reports are supplied by Certo as part of the monthly fee, no company names are supplied in these reports).
Your business must achieve the Starter and Operating levels as these form the foundation of a sustainable business. Advanced is the preferred base level of achievement for your business to be regarded as a significant sustainable business performer. The Optimum level is optional. - What market research and industry reporting is highlighting the need for Global Sustainable Action?There is an amazing amount of credible search available through independent researchers. A summary of the latest findings are here for reference (links to creators and owners of the data):
United Nations: The Future is now - Science for achieving Sustainable Development.
Nielsen: Identifying Sustainability Opportunities with Consumers.
Nielsen: Increasing Brand Trust through Sustainability.
Nielsen: Sustainability Continues to Drive Change.
Nielsen: Finding success through Sustainability.
Nielsen: The Influential Customer.
Forbes: Why Sustainable Branding Matters.
Forbes: Trends Shaping Food Products.
Edie: 60 percent of plastic packagers have no Environmental Policies.
Odgers: Trending Ethical Consumption. - What are the Global Environmental Concerns driving the need for change?The media is now reporting on environmental concerns on a regular basis. Your central and local governments are also now implementing policies and guides on what is happening relevant to your business, in your country and in the world. Below are some interesting facts with sources supplied, you can of course also google and discover for yourself.
Science Magazine: In 2018 the amount of CO2 in the Earth’s atmosphere reached the highest level in 800,000 years.
CO2 Earth: 2016 was the warmest year since 1909, the 5 warmest years on record have been in the last 20 years.
WXShift: Last 100 years (to 2018) the temperature of Earth increased by 1.7 oC and the sea by 0.9 oC.
The Economist: Sea temp increases resulted in level increases of 22 cms, forecasted to be further 65 cms by 2100.
Tree Hugger: 50% of Earth’s food supply comes from just Wheat, Rice and Maize (65% for livestock).
Tree Hugger: 90% of global livestock production comes from just 15 species of mammals and birds.
World Resources Institute: Global tree cover loss reached a record 73.4 million acres in 2016, 50% higher than 2015.
Tree Hugger: 20% of the Amazon rainforest has disappeared in just 50 years.
Tree Hugger: 50% of all shallow water corals have been lost in the last 30 years.
Tree Hugger: 75% of the major marine fish stocks are being fished at or beyond their biological limits.
Tree Hugger: All mammals, birds, reptiles, amphibians and fish have experienced a decline of 60% since 1970.
World Resources Institute: We lost a football pitch worth of the Earth’s natural forests every second in 2019.
World Resources Institute: Plastic production was 311 M Tonnes in 2014, 20 times the amount produced 50 years earlier.
CNN Edition: Great Pacific Garbage Patch is about 1.6 M km2 in size. This is about 16 x bigger than estimated.
WorldMeter: By 2037 it estimated the world’s population will reach 9Billion, that is a 3 x increase since 1960. - Who has created Sustainable Businesses and the Certo services?My name is Ken Graham, I am the business owner and the principal consultant. Sustainable Businesses and Certo services are run under the company: Sway Marketing Management Ltd NZCN 1212722.
I am a qualified energy efficiency engineer, management consultant and sustainability advisor, with over 25 years senior management experience in industries directly related to sustainable business management. I have worked and studied in three countries so I have a good feel for sustainable business issues across varying cultures and operating environments (the Certo program and the sustainable businesses resources have all been developed based on this).
My credentials are as follows:
Awards
Electricity Supply Industry UK, Energy Sales Engineer of Year – Runner Up
Schlumberger Energy Horizons UK, Energy and Commerce Category – Runner Up
AW Goodier Energy Efficiency Initiative NZ – Winner
Licences and Certificates
ISO 14001: EMS Certified (Emirates Foundation)
Life Cycle Assessor (one-click LCA)
Sustainability Practitioner (Centre for Sustainability Excellence)
Corporate Directorship (NZ Institute of Directors)
Technical Paper Authorship
Comparing life-cycle carbon footprints of interior flooring options and proposing improved building lifespan
assessment processes for specifiers. (Presented at the Sustainable Construction Materials and Technologies
Conference, Lyon, June 2024).
Govt Delegation
NZ Govt Energy Efficiency and Conservation Agency Delegate (Centre for Analysis and Dissemination Energy
Technologies)
Tertiary Education
Master of Science - Sustainability in Practice, University of Plymouth, UK.
Master of Marketing Degree - Melbourne Business School, Melbourne University, Australia.
Master of Business Administration Degree - Business School, Massey University, NZ.
Diploma Energy Technology - North Trafford College, Manchester, UK.
HNC Electrical Engineering - Blackpool Technology College, UK.
ONC Electrical Engineering - Preston College, UK.
Certificate Corporate Sustainability - Stern School New York University, USA.
Certificate Global Environmental Management - Technical University of Denmark.
Certificate Circular Economy (Sustainable Materials Management) - Lund University, Sweden.
Certificate Ecosystem Services Design - University of Geneva.
As an experienced manager, researcher, analyst and presenter, I can provide comprehensive sustainable management services. I can combine business analysis, strategy planning, operations, marketing and communications with the technical aspects of manufacturing, product design and distribution.
My relevant work experiences are as follows:
United Kingdom - energy consultant, sustainability manager.
Australia - energy and water efficiency advisor.
New Zealand - energy efficiency advisor, senior official and NZ delegate in central government energy agency, water efficiency advisor, waste management and recycling advisory services, material sourcing and packaging design services, freight distribution analysis, sustainability management and training.
France - creation of new sustainable businesses online consultancy venture, including an online best practice program. - What are your sustainable practice service fees?The cost of achieving sustainable practice depends on the size and complexity of your business, in particular how many products and services you provide:
Contracting charges vary between e60 euro/hr and e100 euro/hr (excluding taxes and travel/accommodation costs).
Workshop fees are e600 (half-day), e1000 (full-day), e1800 (2 days) and e2400 (3 days) (excluding taxes and travel/accommodation costs).
Online workshops are 80% of the above fees (a 20% discount).
The Certo Online Program set up fee is e1,800 euro (excluding taxes) and the ongoing monthly fee is e60 euros/month (excluding taxes).
This fee structure is for a single site business. If multiple sites are included the fee reduces by 10% per site to a maximum discount of 40% across all sites. Example: A company with 5+ sites would receive a 40% discount and would be charged a e1080 set up fee (excluding taxes) per site and each site would pay an ongoing monthly fee of e36 euros/month.
Sustainability is not about loading extra costs into your business, it is about using the same budgets more efficiently and sustainably. This leads to lower operating costs, lower risks, lower stock redundancies and increased future-proofed revenues.
However, you may (and most likely) incur other business costs in achieving your sustainability goals, such as: changes to technology used - relating to energy and water use, like transport, lighting, heating and motors, and changes to materials used and products purchased. These additional costs can be determined during the advisory process using third party suppliers.
Back...